There's a special satisfaction in seeing someone truly grasp a new concept. Yet, in our intricate worlds, players often struggled to visualize their own progress. This wasn't just a missed opportunity for celebration; it was a barrier to deeper engagement. Our mission became clear: transform complex data into a vibrant, personalized narrative of player growth, making every step transparent and rewarding. For Hexolvepuz, this project was pivotal, reinforcing our commitment to user-centric design and proving data can be a powerful tool for empathy and connection, elevating the perceived value of our offerings.
Our Collaborative Force
- The Architects of Insight: Our core team was a dynamic blend: Elena, Lead UX Designer; Dr. Alex, Data Scientist; Ben, Frontend Maestro; Sarah, Backend Engineer; and Marcus, Game Designer. Each brought a vital lens.
- A Symphony of Synergy: Interaction was a constant, energetic dialogue. Daily stand-ups fostered brainstorming. Shared digital whiteboards were our canvases, where design met data, and technical feasibility shaped narrative. Agile sprints, with continuous feedback, ensured data-informed design and aligned technical implementations. Peer reviews fostered shared understanding and collective ownership.
The Breakthrough: From Data Points to Storytelling
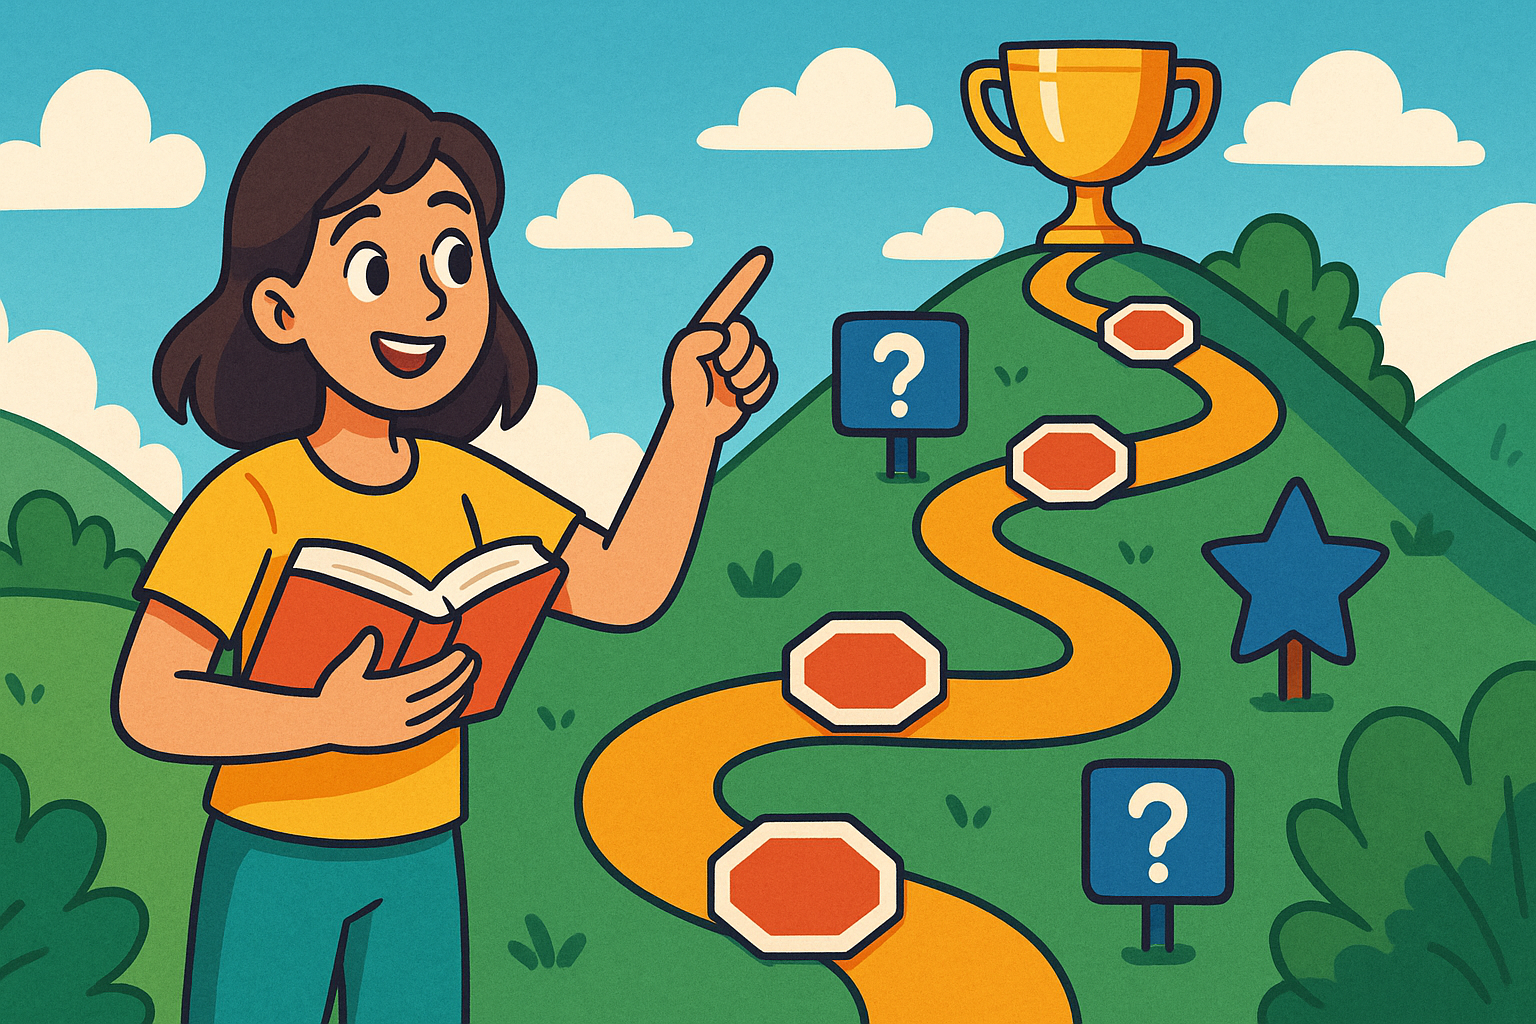
Our journey had a crucial turning point. Initially, data visualizations were traditional dashboards – accurate, but cold. Player feedback was direct: "It's numbers, but what does it mean for me?" We realized we weren't just presenting data; we were failing to tell a story. The epiphany arrived when Elena, our UX designer, sketched a winding path, illustrating player progression not as abstract data points, but as an unfolding, personal narrative with milestones and challenges. This sparked a fundamental shift: from "data reporting" to "data-driven storytelling." This insight transformed our approach, challenging us to infuse empathy into data visualization, making skill acquisition feel personal and deeply meaningful.
The Embodied Journey: What We Created
We launched an interactive, dynamic UI: a personalized learning journey map. This visual narrative highlights player progression, learned concepts, mastery levels, and challenges. It transforms abstract metrics into a clear, engaging overview of growth, enhancing player experience with tangible accomplishment and a clearer path forward. Technically, it pushed our data infrastructure for real-time visualization, developing new APIs for granular player data and strengthening our analytics pipeline.
Reflections and Growth
This project was a profound learning experience. We embraced interdisciplinary collaboration and infusing empathy into data visualization. It refined our iterative design and fostered stronger communication. This deepened Hexolvepuz's commitment to innovate at the intersection of robust technology and intuitive user experience.